


Photo by Wance Paleri on Unsplash
Managing price data on Mongo DB
In this article, I share with you the solution I found for efficiently working with stock price data on MongoDB.


While working on a charting app called UniCharts, I was faced with the question of how to store raw price data from cryptocurrency pairs, and how to read it in the most efficient way. I tried different options and obtained very poor results in terms of both, having an elegant code architecture to handle these operations, and especially when it came to minimizing times and data size during execution. Even though I had no previous knowledge of MongoDB, I decided to give it a try. After a bit of trial and error, I finally chose to use a feature called time series.
Introduction to price data
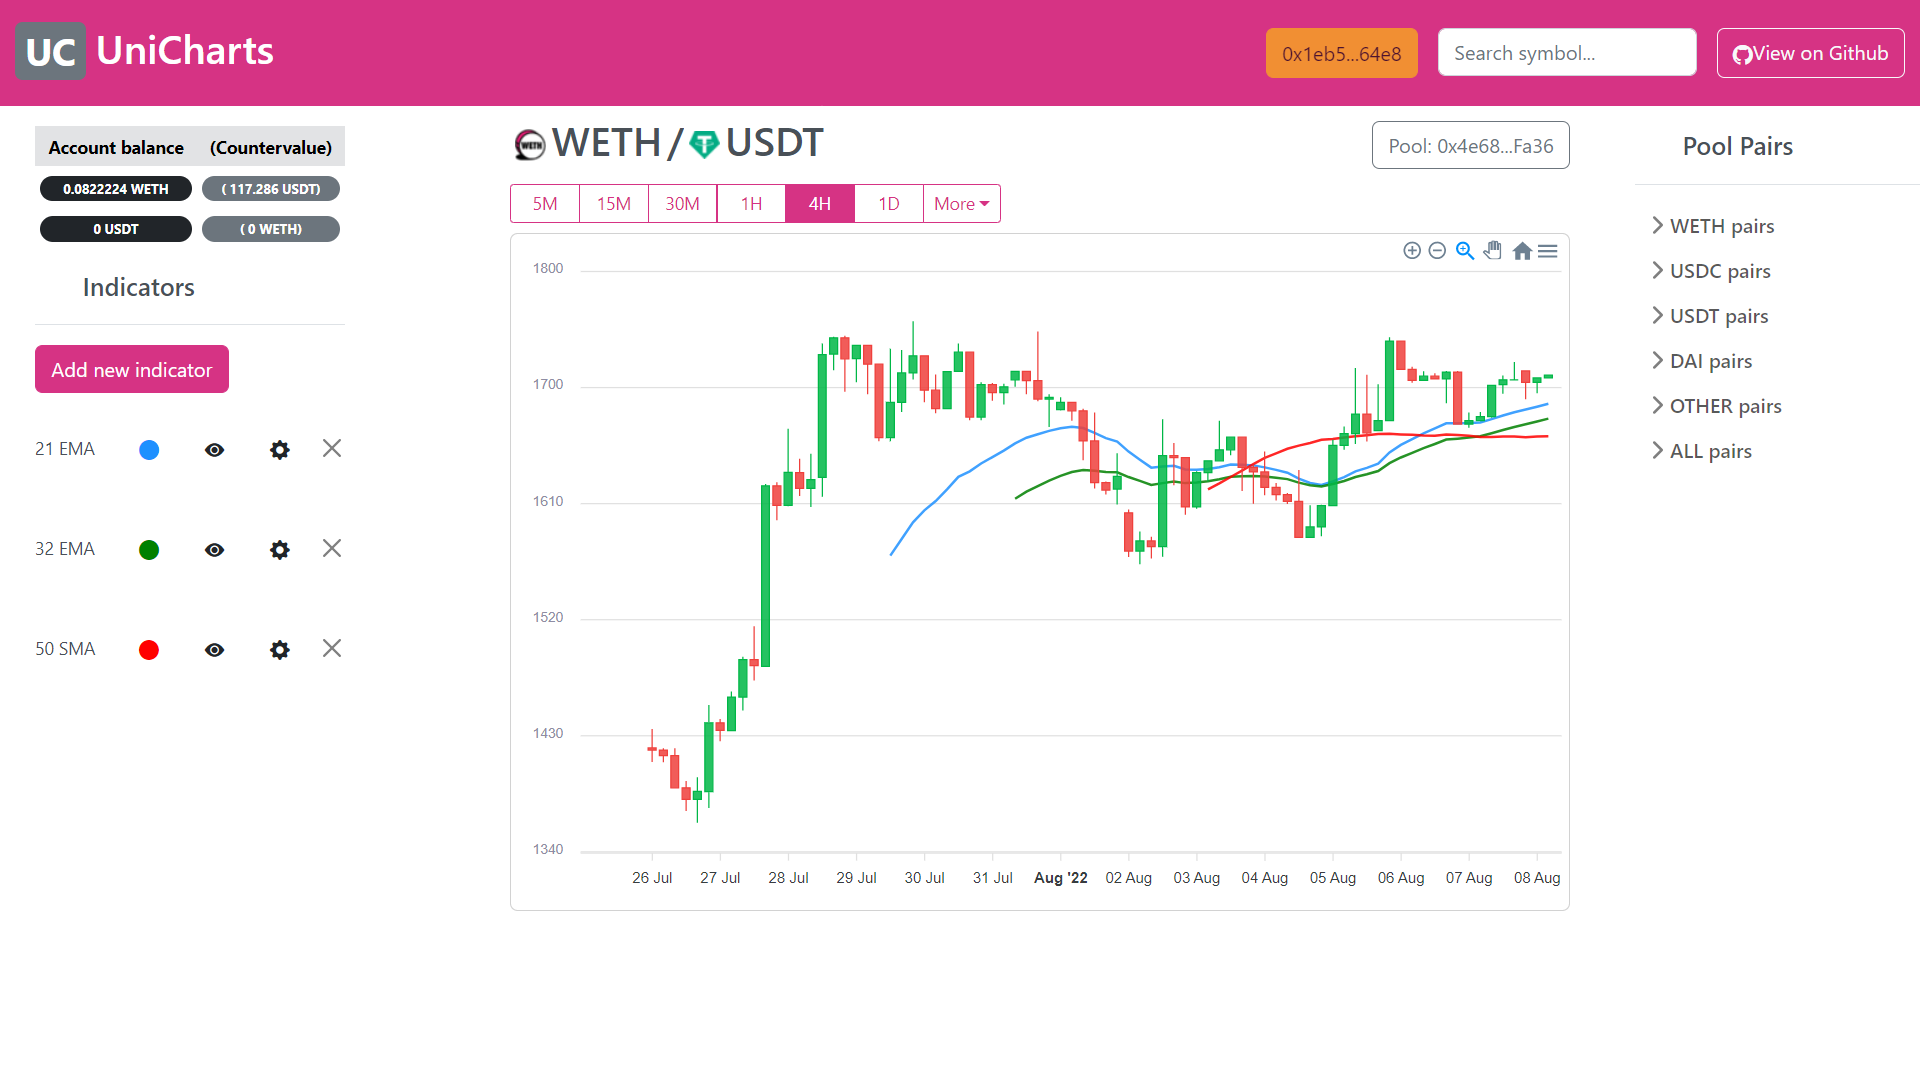
The UniCharts application I was developing has a backend that communicates with different liquidity pools in the Uniswap V3 decentralized exchange (DEX) in the Ethereum blockchain. The smart contracts pools of these pools take an array of timestamps as input and return an array of prices or ratios between each token in the pool for each timestamp.
I call this array of prices an array of observations, or raw price data. The application is set to get price observations every 30 seconds. From these observations, it's possible to generate an OHLC array in the timeframes ranging from 1 minute, all the way up to 1 year, 2 years, and so on.
If for some reason you are new to stock price data, you might be wondering what is this OHLC acronym. Let me give you a quick intro to candlestick charts, which is one of the most widely used charting formats when displaying prices of stocks, foreign and cryptocurrency pairs, options, etc.
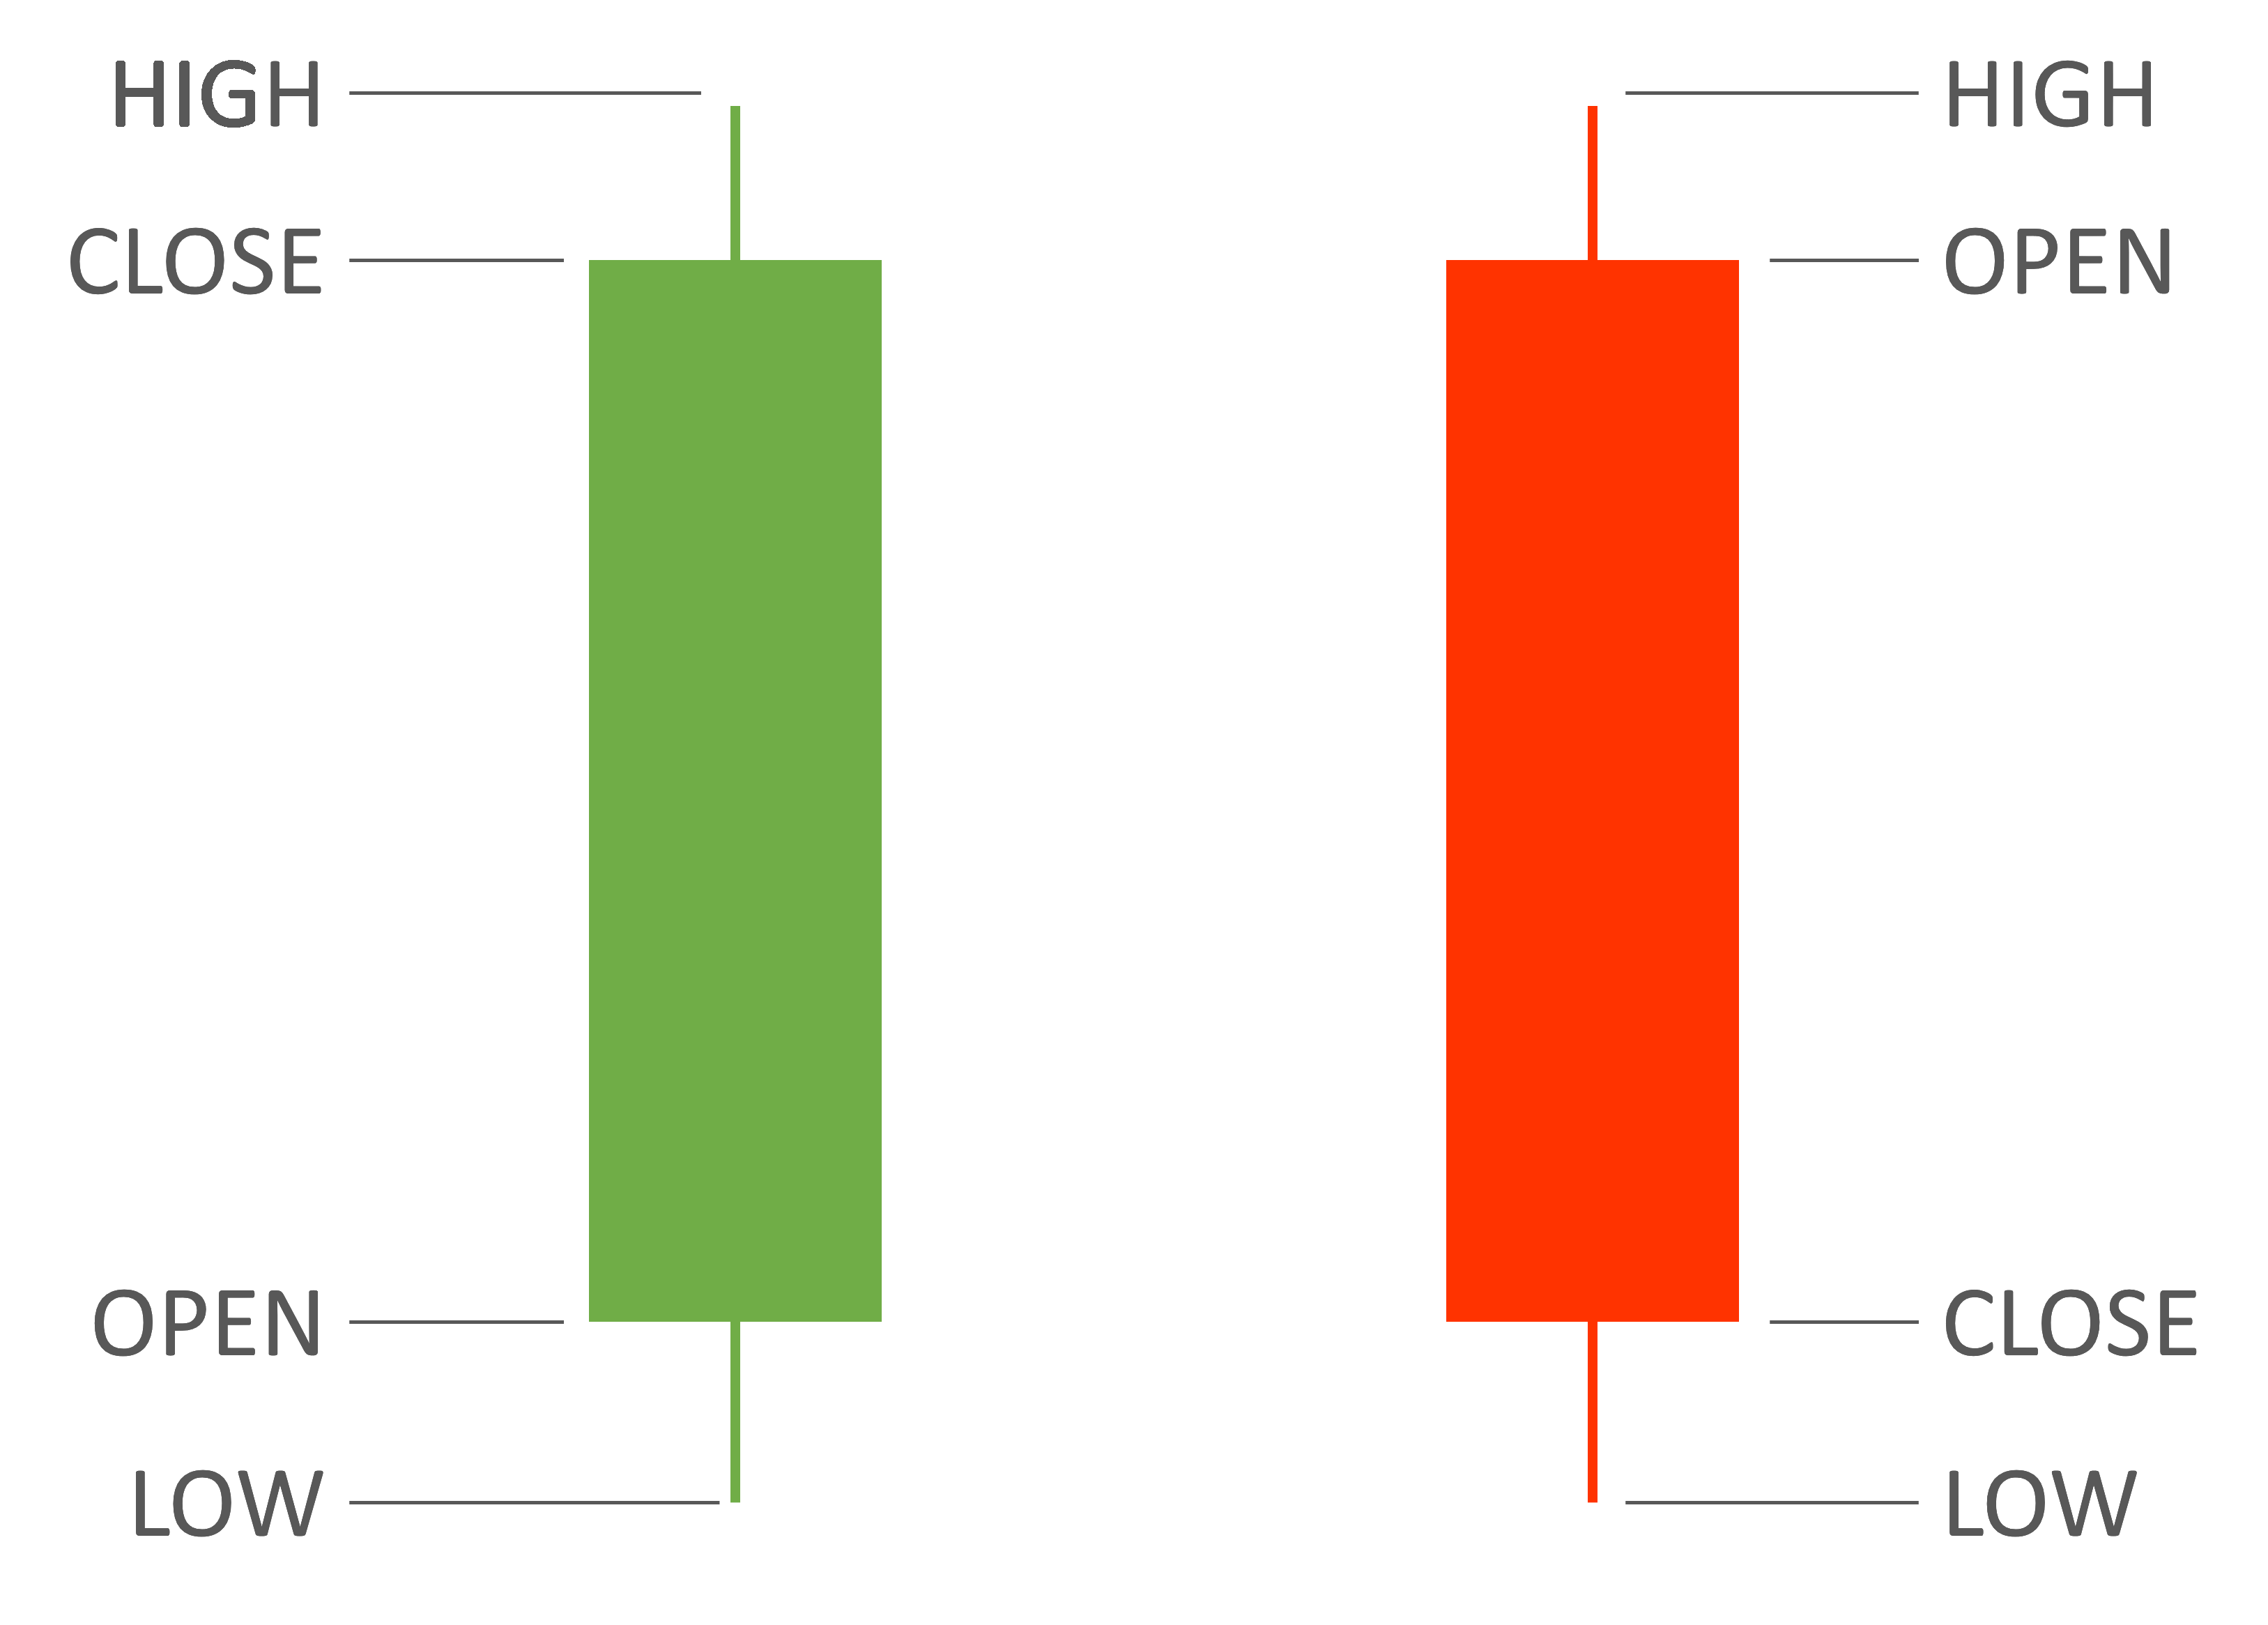
OHLC stands for Open, High, Low, Close. A candle in a candlestick chart is a very efficient way of interpreting what happened to the price of a stock on a particular period of time, or timeframe of the chart.
For instance, in a daily candles chart, a candle shows the price of the stock at the beginning of the day (Open), the highest value it reached (High), the lowest (Low) and the price at the end of the day (Close). When the Close price is greater than the Open price, the candle is usually displayed in green or white color (the price went up). On the contrary, when the Close price is lower than the Open price, the candle is displayed in red or black.
This data can be fed into graph-generating tools, such as Apexcharts.js in the following format:
[[Timestamp], [O, H, L, C]]
How not to store raw price data in MongoDB
My initial idea was to create a MongoDB document that would store both the immutable information and the price data about a certain cryptocurrency pair.
The MongoDB Schema of this model was as follows:
const pairSchema = new mongoose.Schema({
    _id: String,
    symbol: String,
    baseToken: String,
    quoteToken: String,
    poolAddress: String,
    poolFee: String,
    priceObservations: [
        {
            timestamp: Date,
            price: Number
        }
    ]
})
I realized that this model was not the way to go the moment I tried to work with it and realized that it would take ages just to get the initial graph when opening the charting app. Checking on the network tab of the developer tools in the browser would give me a very clear clue: the request asking to read the data of the pair was around 14 Mb in size.
The root of the problem was in the priceObservations array, where all of the raw price data was stored.
    priceObservations: [
        {
            timestamp: Date,
            price: Number
        }
    ]
I realized I need to be able to process data in this array in a more efficient manner.
I had to do 2 things. First, I needed to separate price data from the immutable information about the pair. Second, when requesting price data, I needed to be able to process raw price data at the database level and in the most efficient way. In this way, the size of the responses to price data requests would be as small as possible and thus the response times would dramatically decrease.
After trying different functions and models I found a way to achieve this and this is what I'm sharing in the following paragraphs in case you encounter a similar situation.
Why use MongoDB time series collections for storing stock price data
Since version 5.0, MongoDB features the Time Series collection type.
In a MongoDB time series collection, each observation or measurement is stored in a separate document. This is quite a different approach from the one I tried first, which put each observation of price inside an array.
According to the MongoDB documentation:
storing time series data in time series collections improves query efficiency and reduces disk usage for time series data.
Amazing, we can assume therefore that this type is collection is one of the best options to organize time dependant data, such as stock prices.
Just for reassurance, the documentation goes on to explain that when inserting data in a MongoDB time series collection, this data is organized in a way that optimizes data storage. Thanks to this optimization, retrieving results from time series collection is more time-efficient. I/O for read operations is reduced as well.
How to create a time series collection in MongoDB
Let's take a look first at how we handle the backend, which is used to store the price data.
One way to tell MongoDB that we want to create a time series collection is by creating a mongoose Schema and adding the following object at the end:
const priceSchema = new mongoose.Schema(
    //...
    {
        timeseries: {
            timeField: 'timestamp', // field storing date information,
            metaField: 'metadata', // field making time series unique
            granularity: 'seconds' // granularity
        }
    }
)
Let's see what each of these 3 keys in the timeseries object actually mean:
timeField→ Required. The value of this tells MongoDB the name of the field in the Schema that will store date information. In this case, I am naming the field 'timestamp', just as I could have named it'date'or any other way.'timestamp'seems like a very appropriate convention to use in this case.metaField→ Optional. However, if we have the intention to store price data of more than one stock or currency pair, then we will need to use metadata to discriminate price observations belonging to different symbols. The field name'metadata'is also used as a convention, and any other name can be used if needed.granularity→ Optional. MongoDB uses the value of this field for optimization in how it organizes data in time series collections. The default granularity is'seconds', but it can also be set to'minutes'or'hours'.
Let's now define the whole Schema, taking into account the considerations described above:
const priceSchema = new mongoose.Schema(
    {
        timestamp: Date,
        price: Number,
        metadata: {
            symbol: String,
        },
    },
    {
        timeseries: {
            timeField: 'timestamp',
            metaField: 'metadata',
            granularity: 'seconds'
        }
    }
)
And again, let's break down each of the items we have defined:
timestamp→ This is the field we have defined in thetimeseriesobject astimeField, and is the one that will store data information. The data in the field must be stored in a valid MongoDB BSON Date format.price→ Price data is stored in what MongoDB calls the measurement. This is the value that we are keeping track of in the time series collection. In other types of time series, this could register changes in temperature, voltage, strain, or anything you could imagine that could be measured.metadata→ Again, the name of this key is defined in thetimeseriesobject asmetaField.metadatais an object that contains information about the measurement. In this case, we want to store stock price data, so at least we need to store the name of the symbol that the price belongs to. In other applications, such as lab measurements, we could, for instance, store information about the sensor that made the measurement.
Optimizing data in MongoDB time series collections
It's worth noting that metadata in time series should be kept to a bare minimum, otherwise, we are going to store an incredible amount of redundant data. All the immutable information about the stock, currency pair, option, etc, we are tracking should be kept in a separate collection. This information might include fields, such as:
Market exchange where the security is traded
Long version of the name
Description of the asset
Date of expiry in the case of options
Liquidity pool address in the case of cryptocurrency pairs
Let's see an example of Schema that allows keeping immutable data of cryptocurrency pairs:
const pairSchema = new mongoose.Schema({
    _id: String,
    symbol: String, // ie. "WETHUSDT"
    baseToken: String, // ie. "0xC02aaA39b223FE8D0A0e5C4F27eAD9083C756Cc2"
    quoteToken: String, // ie. "0xdAC17F958D2ee523a2206206994597C13D831ec7"
    poolAddress: String, // ie. "0x4e68Ccd3E89f51C3074ca5072bbAC773960dFa36"
    poolFee: String, // ie. "3000"
})
This data is stored in a single document that belongs to a different collection. Documents from this collection can be linked to time series data using the symbol key.
How to efficiently read stock prices in Mongo DB time series data
We have seen how to handle storing the raw price data in the backend using MongoDB time series.
Now let's take a look at how we leverage the power of the MongoDB time series feature and read the data in a format that is ready to use by our front end.
Creating a MongoDB aggregate
When dealing with stock prices or similar, we will typically want to present the data in a charting-friendly format, such as OHLC (Open, High, Low, Close). Therefore, I will show you an example of how to transform raw price data (price observations) into an OHLC array.
Obtaining formats different from OHLC is relatively easy following this example and changing a few parameters.
In order to obtain the OHLC array, we are going to create a MongoDB aggregation operation. This is one of the handy functionalities MongoDB includes. It computes data and returns it completely processed and ready to use to the front end.
A MongoDB aggregation operation is made by a series of steps called stages, which are bundled together into an array called an aggregation pipeline. If you are an excel nerd like I am, think of it as a macro in which you have a table of data and save a sequence of steps to process that data. For example, you can:
Filter results by date
Delete the columns that you don't need
Create new columns with values computed from the existing data
Sort the resulting table
Transforming time series data into OHLC data
Let's take the excel example into MongoDB language. These are the steps that our aggregation pipeline is going to take:
$match→ First we need to filter the results by symbol and date. From all the documents in the time series collection that belong to different stocks, Forex pairs, etc, we only need the data of one of them. We also might want to retrieve data between certain dates to reduce the final size of the result.$match: { "metadata.symbol" : symbol, timestamp: { $gte: dateFrom, $lte: dateTo }, } // Where for example: // symbol = "WETHUSDT" // dateFrom = new Date("2022-01-01") // dateTo = new Date("2022-12-31")$project→ Now we select the data we want to work with. We only needtimestampandprice, we don't need any information from themetadataobject. In the$matchstage, we tell MongoDB the field we want by giving them a value of 1, and if we want to specify what we don't want we give them a value of 0.{ $project: { timestamp: 1, price: 1, } }$group→ It's now time to build our beautiful OHLC candles.This is the stage where we might want to change parameters and operations a bit, in case we want data in a different format than the OHLC we are using in this example.
It's also worth taking into account that, depending on the timeframes used for the candles, the grouping stage can be quite straightforward or get quite complex. Yearly, monthly, daily, hourly or minute candles can be grouped easily with their corresponding date expression operators. The 2-day, 4-hour, and 15-minute timeframes require a further layer of grouping operations.
Here, the time series documents or measurements that share a certain equal property are going to be put together into the same output document. Let's say we want to obtain daily candles, we would group all price observations sharing the exact same date. We want hourly candles? Then we group by date and also by hour. Let's see how the grouping happens in code in the example of hourly candles:
{ $group: { _id: { $dateFromParts: { year: { $year: '$timestamp' }, month: { $month: '$timestamp' }, day: { $dayOfMonth: '$timestamp' }, hour: { $hour: '$timestamp' }, } }, // Operations with the grouped data } } }What we are doing here is creating a MongoDB document with an
_id. This_idis created using the MongoDB$dateFromPartsdate expression operator, and groups all price data observations that share the same year, month, day and hour. The observations are now grouped in an array and sorted by timestamp.Let's see now how to extract the OHLC (Open, High, Low, Close) values from the array of grouped observations. Thankfully, MongoDB has some very simple expression operators to do this. For the Open and the Close we are going to use the
$firstand$lastoperators respectively. These operators, you guessed it, return the first and the last documents in an array. For the High and the Low, we will simply use the$maxand the$minoperators. The final resulting code of the grouping stage goes as follows:{ $group: { _id: { $dateFromParts: { year: { $year: '$timestamp' }, month: { $month: '$timestamp' }, day: { $dayOfMonth: '$timestamp' }, hour: { $hour: '$timestamp' }, } }, open: { $first: "$price"}, low: { $min: "$price"}, high: {$max: "$price"}, close: { $last: "$price"}, } } }
And here is the final result of how we would read a stock price OHLC array from a time series collection in our front end:
const Price = require('./models/price')
// ...
const getOHLCArray = async (symbol, dateFrom, dateTo) => {
const arrayOHLC = await Price.aggregate([
{
$match: {
"metadata.symbol" : symbol,
timestamp: { $gte: dateFrom, $lte: dateTo },
}
},
     {
         $project: {
             timestamp: 1,
             price: 1,
         }
},
{
$group: {
_id: {
$dateFromParts: {
year: { $year: '$timestamp' },
month: { $month: '$timestamp' },
day: { $dayOfMonth: '$timestamp' },
hour: { $hour: '$timestamp' },
}
},
open: { $first: "$price"},
low: { $min: "$price"},
high: {$max: "$price"},
close: { $last: "$price"},
}
}
])
return arrayOHLC
}
Conclusion
Hopefully, if you encounter a similar need to create a similar application, this article helped you get a better understanding of how to best manage time dependant data using MongoDB time series and aggregation. Do you know other ways of storing and reading stock price data, or other similar types? Let me know!